
Colchester's average home lost £3,197 in August to £294,210, the biggest monthly fall since February 2024. Every type of home is now down on the year.
The average Colchester home sold for £294,210 in August 2026. That is £3,197 less than in July, the city’s biggest one-month fall since February 2024.
The figures come from the HM Land Registry UK House Price Index, published on Wednesday. Over the year the average is down 1.4%, or £4,139. It is the lowest Colchester average since August 2024, and the steepest annual fall since July 2024.
For the first time since December, every type of home in the city is worth less on average than it was twelve months ago.
What each type of home sold for
| Property type | August 2026 average | Change on the month | Change on the year |
|---|---|---|---|
| Detached | £493,135 | -£7,577 | -1.7% |
| Semi-detached | £326,614 | -£3,635 | -0.5% |
| Terraced | £264,000 | -£1,873 | -0.3% |
| Flat or maisonette | £161,277 | -£968 | -3.5% |
| All types | £294,210 | -£3,197 | -1.4% |
| First-time buyer | £247,168 | -£2,310 | -1.2% |
In July, semi-detached and terraced homes were still slightly up on the year. Both have now tipped into small falls.
Detached homes took the largest cash hit, down £7,577 in a single month. Flats fell least in pounds but most in percentage terms. At £161,277, the average Colchester flat is at its lowest since June 2021.
How the year has gone, month by month
| Month | Average price |
|---|---|
| August 2025 | £298,349 |
| September 2025 | £295,503 |
| October 2025 | £296,318 |
| November 2025 | £298,507 |
| December 2025 | £296,165 |
| January 2026 | £295,055 |
| February 2026 | £296,515 |
| March 2026 | £298,324 |
| April 2026 | £299,382 |
| May 2026 | £298,287 |
| June 2026 | £297,595 |
| July 2026 | £297,407 |
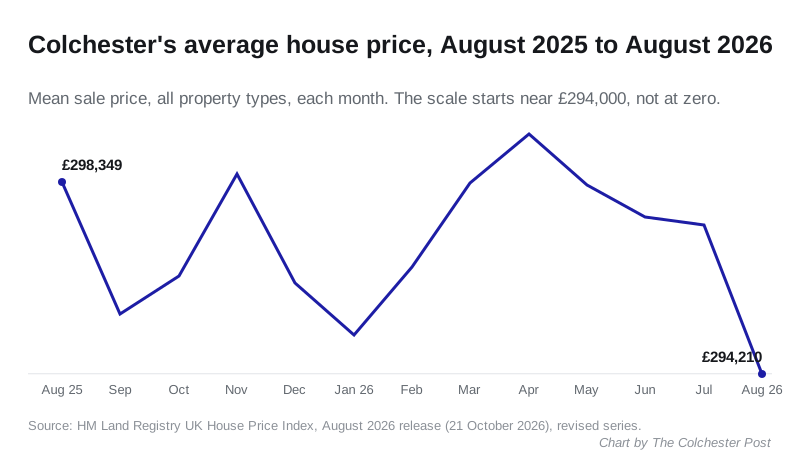
| August 2026 | £294,210 |
For eleven months the average moved within a band of about £4,000. August broke out of the bottom of it. One month is not a trend, and local figures swing more than national ones, so the September release will show whether this sticks.
The longer view is still a slide. The Colchester average peaked at £313,537 in December 2022. It is now £19,327 below that, and the index stands at 94.0 against a January 2023 base of 100.
Colchester against the rest of Essex
Six of the fourteen Essex local authority areas are down on the year. Only Chelmsford and Castle Point fell further than Colchester.
| Area | August 2026 average | Change on the year |
|---|---|---|
| Harlow | £317,453 | +4.3% |
| Braintree | £330,089 | +1.6% |
| Maldon | £393,909 | +1.3% |
| Rochford | £405,340 | +0.5% |
| Basildon | £366,218 | +0.4% |
| Brentwood | £522,672 | +0.3% |
| Uttlesford | £468,166 | +0.1% |
| Southend-on-Sea | £326,132 | 0.0% |
| Epping Forest | £530,653 | -0.3% |
| Tendring | £260,636 | -1.2% |
| Colchester | £294,210 | -1.4% |
| Thurrock | £319,969 | -1.4% |
| Chelmsford | £376,682 | -2.4% |
| Castle Point | £357,241 | -4.0% |
Colchester is still the second cheapest place to buy in Essex. Only Tendring, at £260,636, is cheaper. Chelmsford costs £82,472 more on the average, and Braintree next door costs £35,879 more.
Nationally the picture runs the other way. England’s average rose 0.4% to £293,525, which leaves Colchester just £685 above the English average. Across all 295 English local authority districts, 107 fell over the year. Colchester’s fall was the 61st steepest.
Rents are rising, but slowly
The Office for National Statistics publishes rents alongside the price index. Its Colchester page puts the average private rent at £1,200 a month in September 2026. That is up 1.7% from £1,180 a year earlier. Across the East of England, rents rose 3.8%.
What it means for you
- If you are selling, especially a detached house, August’s figures say buyers have the upper hand for now. Price to the street, not to 2022.
- If you are buying your first home, the first-time buyer average is down £2,310 in a month and 1.2% on the year. Colchester is £82,472 cheaper than Chelmsford on the same main line.
- If you rent, Colchester rents are rising at well under half the regional rate.
Two caveats go with every month of this data:
- UKHPI is a mean average, not a median. It covers places as different as Lexden, Greenstead, Wivenhoe and Stanway, and a handful of large sales can move it.
- The latest months are provisional. The Land Registry revises them as more sales are registered. July has already moved: we published £297,824, and it now reads £297,407.
Our Colchester house prices page carries the longer picture. If you are working out the running costs of a move, the Colchester council tax bands page has the 2026/27 charge for every band.
The next release, covering September 2026, is due at 9.30am on Wednesday 18 November.
Sources:
- HM Land Registry, UK House Price Index full file, August 2026, published 21 October 2026, read on 22 October 2026: the Colchester averages, monthly and annual changes, property types, first-time buyer average and index; the revised monthly series from August 2025; the figures for the other Essex areas, England and all English districts.
- Office for National Statistics, Housing prices in Colchester, updated 21 October 2026: private rents.
- Our report of the July 2026 index, published 21 September 2026, for the July figures since revised.
Contains HM Land Registry data (c) Crown copyright and database right 2026, licensed under the Open Government Licence v3.0.
Have your say