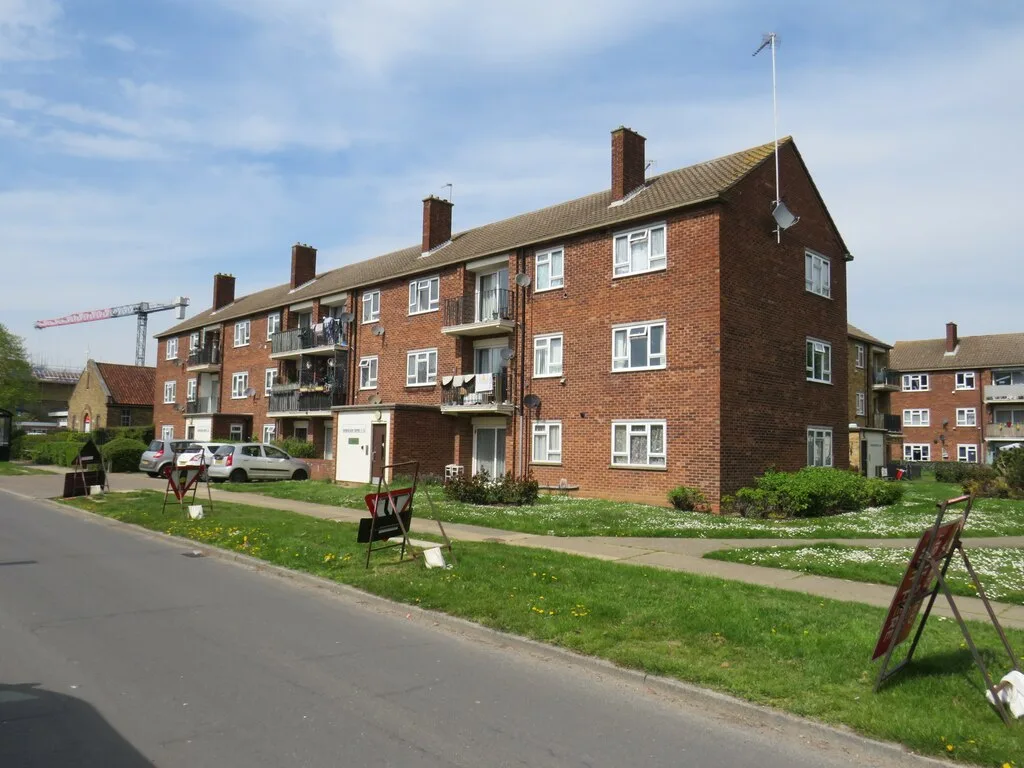

The average Colchester flat sold for £162,307 in July, below its July 2021 level. The city average fell 0.5% over the year to £297,824, 8th of 14 in Essex.
The average Colchester flat sold for £162,307 in July 2026, according to figures published on 18 September in the HM Land Registry UK House Price Index. That is £399 below the July 2021 figure of £162,706, so five years of owning a flat in the city has produced no gain at all on the average.
Flats are the outlier. Across all property types the average Colchester home sold for £297,824, down 0.5% on the year, a fall of £1,453, and up 0.2% on the month.
What each type of home sold for
| Property type | July 2026 average | Change on the year |
|---|---|---|
| Detached | £501,116 | -0.5% |
| Semi-detached | £331,089 | +0.6% |
| Terraced | £266,290 | +0.4% |
| Flat or maisonette | £162,307 | -3.2% |
| All types | £297,824 | -0.5% |
| First-time buyer | £249,875 | -0.4% |
Two things stand out. Semi-detached and terraced homes, which is most of the city’s housing, held their value or gained slightly. Flats lost 3.2%, and they have been falling for longer than that: the Colchester flat average peaked at £180,282 in December 2022 and is now £17,975 below it.
That matters beyond flat owners. A flat is the cheapest way into the market in Colchester, and the first-time buyer average of £249,875 is itself down 0.4% on the year. Anyone who bought a flat in order to move up from it is finding that the first rung has not carried them anywhere.
Colchester in Essex: 8th of 14, second cheapest
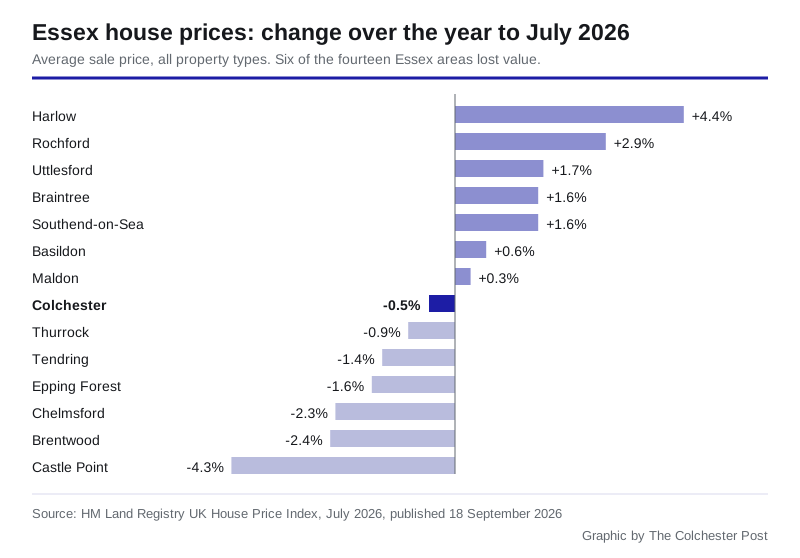
Essex as a whole fell 0.3% over the year, and six of its fourteen local authority areas lost value. Colchester is in the falling half, but nowhere near the bottom.
| Area | July 2026 average | Change on the year |
|---|---|---|
| Harlow | £319,860 | +4.4% |
| Rochford | £412,543 | +2.9% |
| Uttlesford | £476,329 | +1.7% |
| Braintree | £328,477 | +1.6% |
| Southend-on-Sea | £328,383 | +1.6% |
| Basildon | £367,233 | +0.6% |
| Maldon | £389,529 | +0.3% |
| Colchester | £297,824 | -0.5% |
| Thurrock | £321,941 | -0.9% |
| Tendring | £259,568 | -1.4% |
| Epping Forest | £525,719 | -1.6% |
| Chelmsford | £378,080 | -2.3% |
| Brentwood | £514,480 | -2.4% |
| Castle Point | £356,579 | -4.3% |
On price rather than direction, Colchester remains the second cheapest place to buy in Essex, behind Tendring at £259,568. Chelmsford, the next city down the main line, costs £80,256 more than Colchester on the average, and Braintree next door costs £30,653 more.
Across England the picture was the other way. The national average rose 1.1% to £293,479 and the East of England rose 0.5% to £337,518. Set against all 295 English local authority districts, Colchester’s -0.5% is the 75th lowest annual change, and 85 districts fell. So the city is in a falling minority, and in the shallower part of it.
The peak is still nearly £16,000 away
The Colchester average peaked at £313,537 in December 2022. Three years and seven months later it is £15,713 below that, and the index stands at 95.2 against a January 2023 base of 100.
Sales are thin, too. The last month with a published sales count is May 2026, and the January to May totals run:
- 2026: 876 sales
- 2025: 1,204 sales
- 2024: 900 sales
- 2023: 914 sales
The 2025 figure needs the caveat that always goes with it. March 2025 alone recorded 495 sales in Colchester, against 200 in March 2026, because buyers rushed to complete before the 1 April 2025 stamp duty change. Take March out of every year and the January-to-May totals are 676 in 2026, 709 in 2025 and 720 in 2024. On that basis the market is slightly quieter than last year, not a quarter down.
What it means for you
If you are selling a flat, the market is not going to do the work for you. The average is below where it was five years ago and 10% below its December 2022 peak, and it is the only property type in the city that fell materially this year.
If you are buying your first home, the same numbers are the good news. The first-time buyer average is down on the year, Colchester is the second cheapest district in Essex, and it is £80,256 cheaper than Chelmsford on the same commuter line.
If you are just watching the value of your own house, note what this index is. UKHPI is a mean average, not a median, and it covers a district of very different places, from Wivenhoe and Lexden to Greenstead and Stanway. One large sale moves a mean. In a district recording about 175 sales a month, it moves it noticeably.
Our Colchester house prices page carries the longer picture and the sources, and if you are working out the running costs of a move, the Colchester council tax bands page has the 2026/27 charge for every band.
The next release, covering August 2026, is due at 9.30am on Wednesday 21 October 2026.
Note on revisions: UKHPI restates earlier months as more sales are registered. Our June story published a June average of £298,003. June is now restated at £297,349, £654 lower. Figures in this article are from the July 2026 release.
Sources: HM Land Registry UK House Price Index, July 2026, published 18 September 2026, and the full UK HPI data file for the same month, which carries every English local authority. Contains HM Land Registry data (c) Crown copyright and database right 2026, licensed under the Open Government Licence v3.0.
Have your say