
The average Colchester home cost £298,003 in June, second lowest of Essex's 14 districts and £15,534 below the December 2022 peak. Prices by type, and sales.
Update, 21 September 2026. HM Land Registry has since revised June down. The June average now reads £297,349, £654 below the £298,003 published in the release this article was written from. The July 2026 figures are out, and they put the average at £297,824.
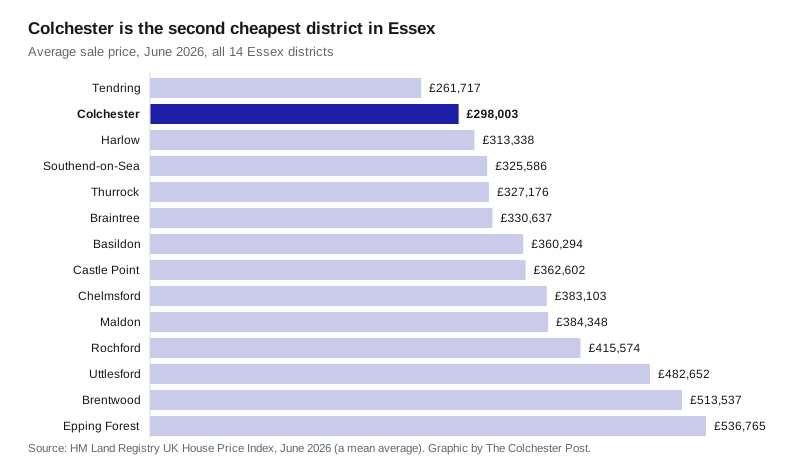
The average home in Colchester sold for £298,003 in June 2026, which makes the city the second cheapest place to buy in Essex, out of fourteen districts. Only Tendring, at £261,717, is lower.
That figure comes from the June UK House Price Index, published by HM Land Registry and the Office for National Statistics at 09:30 on 19 August. (UK House Price Index, Colchester, June 2026)
It is down 0.3% on June 2025 and down 0.1% on May. Both of those are small numbers, and that is the actual story. Colchester’s average price has now spent more than a year going nowhere.
Where Colchester sits in Essex
Essex as a whole rose 1.2% over the year. Five of its fourteen districts fell, and Colchester is one of them, though its fall is the shallowest of the five.
The five districts where prices fell over the twelve months to June:
- Brentwood, down 1.6%
- Chelmsford, down 1.2%
- Castle Point, down 1.1%
- Basildon, down 1.0%
- Colchester, down 0.3%
The biggest risers were Rochford, up 6.2%, and Epping Forest, up 4.9%. (UK House Price Index, Essex districts, June 2026)
Colchester is £63,265 below the Essex average of £361,268, and only £4,741 above the England average of £293,262. For a city of its size in the south east, that is unusual, and it is the single most useful fact in the release for anyone deciding where in Essex to look.
The fall is in flats and detached houses
The headline 0.3% hides two markets moving in opposite directions.
| Property type | June 2026 average | Change on the year |
|---|---|---|
| Detached | £501,997 | down 0.8% |
| Semi-detached | £331,517 | up 0.8% |
| Terraced | £265,637 | up 0.7% |
| Flat or maisonette | £162,504 | down 2.4% |
Semis and terraces, the bulk of what actually changes hands in Colchester, both rose. Flats fell 2.4%, the steepest move of the four. A flat in Colchester now averages less than a third of a detached house.
The first-time buyer average was £249,928, down 0.1% on the year. That is comfortably below the £300,000 first-time buyer stamp duty threshold, so most first purchases in the city still fall outside it.
Prices are still below the 2022 peak
Colchester’s average price peaked at £313,537 in December 2022. It is now £15,534 lower, a fall of 5.0% over three and a half years.
The last thirteen months have been flatter still. The average has moved between £295,639 in January 2026 and £300,011 in November 2025, a range of £4,372, or about 1.5%. June 2025 was £298,894. June 2026 is £298,003. A year of trading moved the number by £891.
Fewer people are moving
Sales volumes lag prices by about two months in the index, so the most recent publishable count is April 2026: 159 completed sales in the district.
That is low. Two periods sit below it since 2020. One is the first Covid lockdown. The other is April 2025, when only 98 sales completed after the stamp duty threshold changed on 1 April. Otherwise 159 is the lowest monthly count the district has recorded in six years.
The stamp duty distortion is worth seeing in full, because it makes any year-on-year sales comparison for spring meaningless:
- March 2025: 495 sales, as buyers rushed to complete
- April 2025: 98 sales
- March 2026: 180 sales
- April 2026: 159 sales
What it means for you
If you are selling. The market is not falling away, but it is not carrying you either. A semi or a terrace is in the stronger half of the market; a flat is in the weaker half, and has lost 2.4% in a year. Price against what has actually completed nearby rather than against 2022.
If you are buying. Colchester remains one of the cheapest districts in Essex, and the gap to Chelmsford is now £85,100. Low sales volumes usually mean less competition per property and more room to negotiate.
If you are a first-time buyer. At £249,928 average, most Colchester purchases sit below the £300,000 stamp duty threshold for first-time buyers.
A caution on the figures. The UK House Price Index is a mean average, not a median, so a handful of expensive sales pull it upwards. It is also revised every month: Colchester’s May average read £298,257 before the June release and £298,405 after it. Treat a single month as a wobble, not a trend.
Our Colchester house prices page carries the longer view, and Colchester planning news tracks what is being built and where.
Sources
- UK House Price Index, Colchester, June 2026 (HM Land Registry) for the district average, monthly and annual change, property-type and first-time-buyer figures.
- UK House Price Index browser (HM Land Registry) for the fourteen Essex districts, Essex, and England.
- UK HPI full data file, June 2026 (HM Land Registry) for the monthly sales volumes and the December 2022 peak.
Have your say